
FULL PROJECT SIMULATIONYHR_2026_05MONTH 7 / 12
KUPS SEI SERAMPAK INDAH
From management to benefits
A full-project demonstration of how PORTAL can track programme progress, outcomes, activities, evidence, risks, market development and plant-level field records in one place.
DEMO DATA / SIMULATION
The project identity, 12-month design, 5.7 ha area, four outcomes and twelve KPIs follow the verified proposal. The month-7 status, 60% progress, KPI values, activities, evidence counts, market records, risk ratings and plant audit records below are illustrative assumptions only and are not official project results.
PROJECT SIMULATION
Month-7 programme dashboard
This view assumes the programme has entered the B7-B9 phase after T1 and is approximately 60% complete overall.
Programme progress60% complete, with T1 completed and corrective actions under implementation.
60%12-MONTH ROADMAP
Where the project sits now
Months 1-6 are treated as completed or substantially completed in this simulation. Month 7 begins the strengthen-and-transfer phase.
OUTCOME PROGRESS
Four programme outcomes
Simulated outcome percentages are chosen so the overall programme state remains approximately 60%.
KPI TRACKER
Twelve core indicators
All current values below are simulated month-7 values. Proposal targets are preserved as the reference frame.
| KPI | 12-month target | Month-7 simulated value | Status |
|---|
ACTIVITY TRACKER
Programme activity history
This simulated activity log demonstrates how PORTAL can combine planning, completion status, results and follow-up.
EVIDENCE & RECORDS
What has been documented
Illustrative evidence counts show the intended connection between activities, monitoring, spatial data, transactions and review notes.
ADAPTIVE MANAGEMENT
Current risks and responses
Risk ratings are simulated but follow issues already recognised in the programme design.
PUBLISHED REAL LOCATION
Agroforestry hut location
This point is the real, owner-confirmed location of the KUPS Sei Serampak Indah agroforestry hut and is separate from all simulated programme values on this demo page.
- Published coordinate
- -0.295097, 101.717926
Real project frame, simulated programme state.
View full public mapSIMULATED FIELD MODULE
Plant-level agroforestry audit
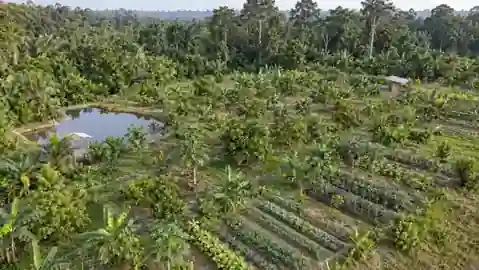
The original plant audit remains as one module within the wider project demo. Click a point to inspect the simulated plant record.
DEMO / SIMULATED
Illustrative aerial background. Not an orthomosaic or surveyed boundary.Selected: DEMO-MPTS-001
NEXT SIX MONTHS
What remains after month 7
PORTAL rule
Every value on this demo that is not a verified project fact is explicitly treated as simulated. Official results should only be shown after evidence is collected, reviewed and verified.